1. Create a Cluster of Existing Managed Servers
Go to WebLogic Server Administration console.
http://localhost:7001/console
Under Domain Structure, expand Environment and select Servers.
On the Summary of Servers page, select Control. If any of the Managed Servers are in the RUNNING state, shut them down.
In the Change Center, click Lock & Edit.
Under Domain Structure, expand Environment and select Clusters.
In the Clusters table, click New, and then select Cluster.
Name: cluster1
Messaging Mode: Unicast
On the Settings for cluster1 page, select Configuration, and then Servers.
In the Servers table, click Add.
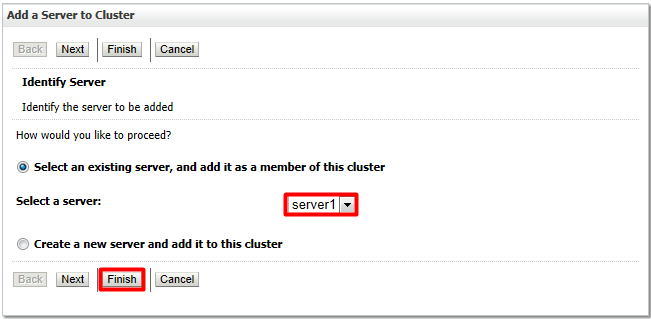
On the Add a Server to Cluster page, select the Managed Servers:
Select the option to add an existing server to the cluster and choose the Managed Server server1 from the drop-down list.
Click Finish.
Repeat for server 2 and server 3.
In the Change Center, click Activate Changes.
The Console displays the message: All changes have been activated. No restarts are necessary.
2. Start the Clustered Servers
To start the Managed Servers in a cluster:
For each machine where Managed Servers are to be started, ensure that the Node Manager is configured properly and is in the Reachable state.
In the left pane of the Console, expand Environment and select Machines.
Select the name of the machine where you want to view the Node Manager status.
On the Settings for Machine page, select Monitoring and then Node Manager Status.
In the WebLogic Server Administration Console, under the Domain Structure, select Clusters.
In the Clusters table, select cluster1 (the newly created cluster).
On the Settings for cluster1 page, select Control.
In the Managed Server Instances in this Cluster table, select the Managed Servers that are in the SHUTDOWN state.
Click Start and confirm to continue.
The selected Managed Servers start.
Click Refresh refresh icon and ensure that all the Managed Servers are in the RUNNING state.
3. Monitor the Cluster
In the Administration Console, under the Domain Structure, select Environment and then Clusters.
In the Clusters table, select cluster1.
On the Settings for cluster1 page, select Monitoring and then Summary.
To see more information about the servers in the table, click Customize this table and add the columns to the table that you want to display.


No comments:
Post a Comment